Growing an insurance app
without overspending on ads.
Paid campaigns, app-store discovery, and renewal—treated as one acquisition system, not three separate activities.
The situation
A once-a-year insurance product, with margins set by insurers. Buying an install was only the beginning of the economics.
The stakes
Year one needed to pay for acquisition. Renewal needed to cost very little. Otherwise growth was a subsidy, not a business.
What I owned
Channel structure, store listing, instrumentation, and the renewal loop. The constraint: a full annual cohort takes twelve months to read.
The dashboards, and the read.
Three original artifacts from the published case study. Switch views to see what each can—and cannot—tell us.
The decisions behind the numbers.
The work wasn’t simply to make the cheapest campaign cheaper. It was to connect how people find the app with what happens after they install it.
Read costs at campaign level.
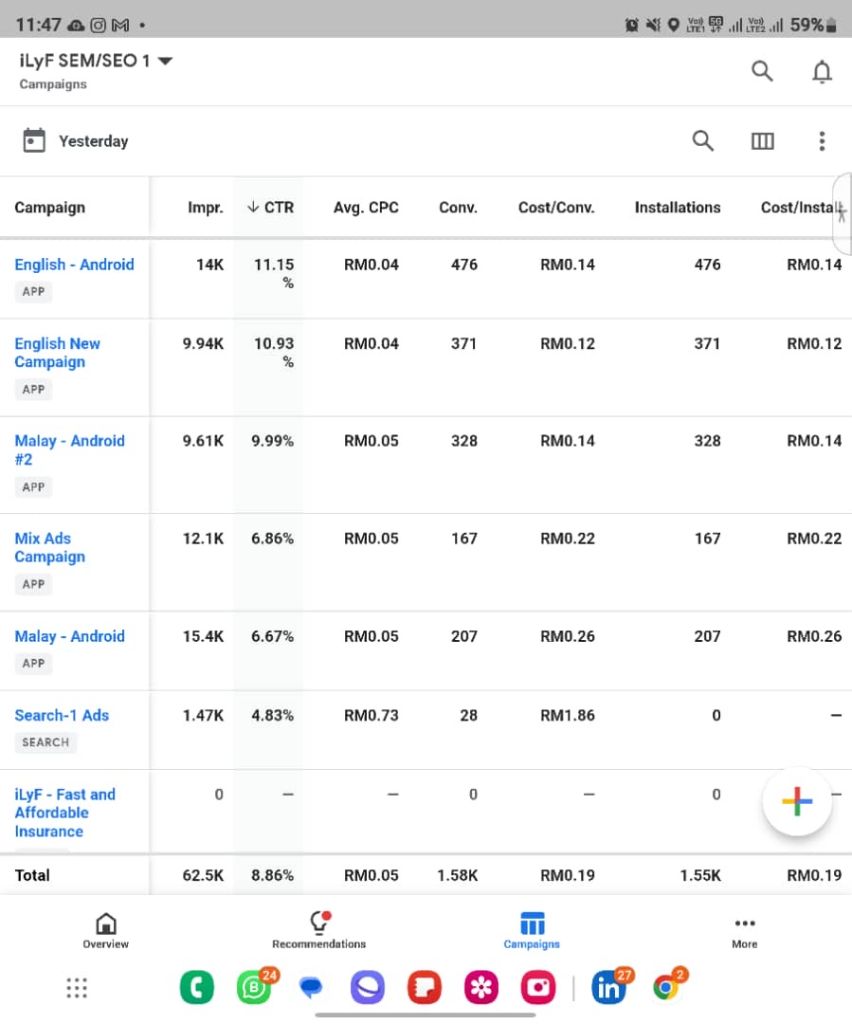
The single-day dashboard has app campaigns between RM0.12 and RM0.26 per install. A blended number hides that spread. The published account focuses on cost per install rather than treating click-through rate as the outcome.
Build discovery between bursts.
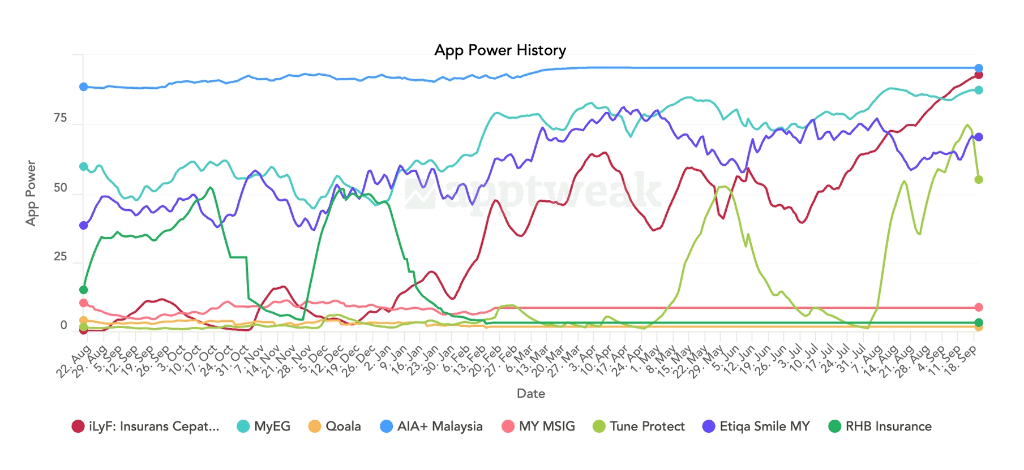
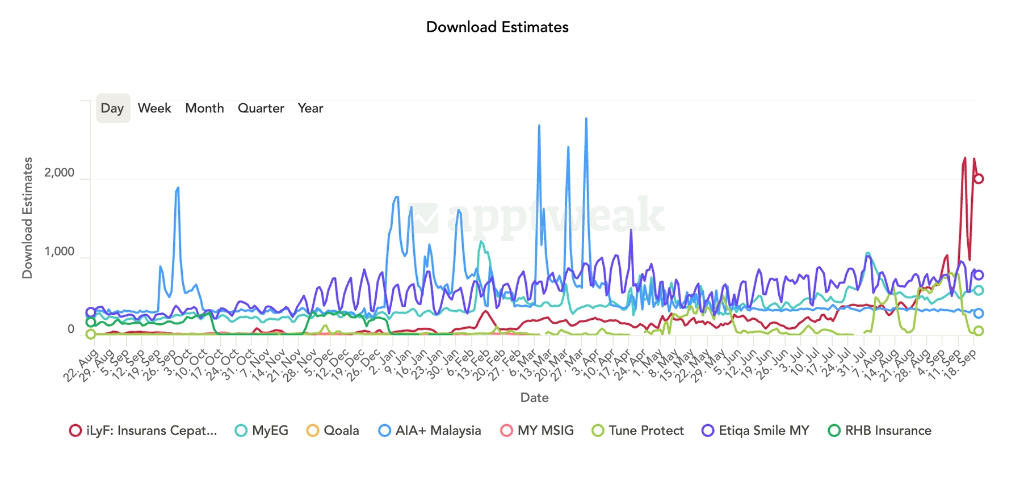
Store listing and review work sat alongside paid campaigns. The AppTweak charts show visibility building and a higher floor between download peaks. That is a useful signal to investigate, not standalone proof of organic attribution.
Make the second year part of the product.
The acquisition responsibility included the renewal loop. In the platform case study, reminders run at 60, 30, 7, and 1 days before expiry. For an annual product, retention belongs in the product design—not only in a marketing calendar.
Tools and practices: Google Ads app campaigns · ASO and store listing · AppTweak · Mixpanel · Cohort and ROAS dashboards · Lifecycle automation
What changed. What the figures mean.
Separate the long-window result from the short-window snapshot, and an install from a registration.
Monthly cost per install
RM0.20–1.92Monthly actuals, Apr 2023–May 2024. A measured range—not the best day presented as typical performance.
Single-day blended CPI
RM0.19The Google Ads screenshot above. Its “Yesterday” filter has no calendar date visible. It does not establish a sustained acquisition cost.
Cost of a completed sign-up
RM3.04 → RM2.18Q3 to Q4 2024 averages. Registrations are not necessarily paying customers.
Store visibility
Near zero → secondiLyF finishes second in the displayed AppTweak comparison. Visibility is not market share, revenue, or customer count.
These figures are reported in my portfolio and case study; they have not been independently audited here. The images are original published artifacts. They do not contain the underlying monthly exports needed to independently reproduce every result.
Complete case account, metrics and measurement limitations
Connected paid campaigns, app-store discovery, and retention to lower acquisition costs. The case study shows monthly results, with peak performance labelled separately.
No market benchmark is treated as a like-for-like comparison here. The Google Ads screenshot shows a single day; AppTweak downloads are estimates. Attribution settings, spend exports, and the calendar date of the daily snapshot are not supplied.
- Situation
- A once-a-year insurance product where every customer starts as a paid install and lifetime value is capped at one annual premium at a fixed margin.
- Stakes
- Unless installs came in cheap enough for year one to pay for itself and year two to cost near nothing, the acquisition engine was a subsidy, not a business.
- My role
- Co-founder and Chief Product Officer. Owned acquisition end to end, including channel structure, store listing, instrumentation and the renewal loop.
- Constraints
- Finance apps are the most expensive category to acquire in. Margins were set by insurers, and a cohort in a once-a-year product is unreadable for twelve months.
- What changed
- Cost per install ran RM0.20–1.92 monthly, under the published Android and APAC averages every measured month
- LTV:CAC reached 4.4–4.9 in Q4 2024, with acquisition cost recovered in ~0.6 months
- Category visibility climbed from near zero to second among every insurer app in Malaysia
- Read this if
- Your growth spend keeps rising and you cannot say which part of the funnel is earning it back.
All published metrics
- cost per install, monthly actuals across the measured period
- RM0.20–1.92
- blended cost per install on the single day the dashboard below shows
- RM0.19
- monthly click-through rate, against a 6.66% cross-industry average
- 3.9–9.8%
- of ad clicks became installs, monthly
- 15.7–21.3%
- LTV to CAC in Q4 2024, against a 3:1 healthy benchmark
- 4.4–4.9
- to recover customer acquisition cost
- 0.6 months
- return on ad spend, Q3 to Q4 2024, with net crossing 1.0 in Q4
- 1.21 → 1.65
- category visibility against every insurer app in the market
- Near-zero → top 2
Context
- Motor insurance is bought once a year by people who do not think about it in between.
- There is no habit to build on and no daily usage to grow, so every customer starts as an install somebody paid for.
- The ceiling on what that install can be worth is fixed: one premium, once a year, at a margin the insurer sets.
- That ceiling is the entire problem to solve.
What was actually needed
- Two numbers, not a campaign.
- A cost per install low enough that a first-year customer paid for themselves.
- A second year that cost close to nothing to win.
- Everything I did to the channels was in service of those two, and anything that moved a metric without moving one of them got cut.
What the campaign table told me
- The search campaign was buying clicks at RM0.73 against RM0.04 to RM0.05 on the app campaigns, converting at RM1.86, and producing zero installs. It was paying premium rates for intent the store listing was already capturing for free.
- The blended “Mix Ads” campaign came in at RM0.22, worse than every dedicated campaign it was blended from, because mixed targeting averages you into your most expensive audience instead of letting the cheap one run.
- The two Malay campaigns landed at RM0.14 and RM0.26. Same language, same product, nearly double the cost, which said the variance was creative rather than audience.
- Running the whole table back: 62.5K impressions at 8.86% is roughly 5,500 clicks, which produced 1.55K installs. That is a store listing converting a bit over a quarter of everyone it saw that day, and it is the real reason cost per install was twenty sen rather than eighty.
- Sustained across whole months the conversion ran lower, between 15.7% and 21.3%. The day below is the ceiling, not the baseline.
What I did with that
- Killed search entirely and moved the budget into app campaigns.
- Split every blended campaign into single-audience ones, so a cheap segment could not subsidise an expensive one inside a single average.
- Ran each language twice with deliberately different creative, because the RM0.14 against RM0.26 gap said creative variance was worth more than another audience test.
- Treated the store listing, meaning title, screenshots, description, ratings and replying to reviews, as a paid channel with its own budget of attention. Roughly a quarter of the cost per install was set there rather than in the ad.
What the visibility curve told me
- AIA+ holds a flat line near the top for the whole period. That is brand spend, and it is not a game a startup wins.
- RHB spikes to the middle of the chart and collapses back to zero inside two months, and Tune Protect does the same thing twice. Those are burst campaigns, and the collapse is what a burst always does.
- Our line does neither. It sits near zero for months, then climbs steadily for eight of them, past MyEG, past Etiqa Smile, into second place behind an incumbent insurer.
- A slope like that cannot be bought in a burst. It is the compounding return on listing quality and review responses, and it is the cheapest visibility in the category because nobody else was willing to wait for it.
Why the two charts are one story
- Put the download chart next to the visibility chart and the mechanism is visible.
- Early on, our downloads are pure spikes with a floor at zero. Everything we got, we bought, and the day the campaign stopped so did the installs.
- By the end of the window the floor between spikes has lifted well clear of zero, and the spikes themselves reach the top of the chart.
- Same campaigns, taller peaks, because paid traffic now landed on a listing that ranked and converted.
- Paid efficiency was not won in the ad account. It was won on the store page, and the ad account is where it showed up.
Decisions that mattered
- Optimising bidding toward policies bought rather than installs. Install is the cheap, fast, satisfying number and it is the wrong one, because it rewards whichever audience is most willing to download something free.
- Once the campaigns were fed conversions further down the funnel, the cheap-install audiences dropped out on their own.
- Refusing to judge a channel before renewal data existed for it. In a once-a-year product a cohort is not readable for twelve months, and every premature verdict we made in the first year was wrong.
What changed
- Across the measured months, cost per install ran between RM0.20 and RM1.92. The twenty-sen days were real, but they were the good days rather than the average one.
- Installations reached the low hundreds of thousands over thirty months, with several months inside the Google Play Store’s top 10 Lifestyle apps.
- Return on ad spend moved from roughly 0.5 to 1.21 by Q3 2024 and 1.65 by Q4, and net return crossed 1.0 in that final quarter, the point at which acquisition stopped being funded and started paying for itself.
- The honest attribution is the renewal automation rather than anything in the ad account, because a second year won at almost no cost is what finally made the first year’s spend affordable.
The insight I kept
- Cost per install is a vanity number until you divide it by the people who actually buy something.
- The most useful hour I spent on this was not in the ads manager. It was working out that a quarter of my paid efficiency was being set by a store page I had been treating as marketing collateral rather than as the top of the funnel.
Original artifact captions
One day across the live app campaigns. Read down the cost-per-install column rather than the click-through column: RM0.12 on the best campaign against RM0.26 on the worst, for the same product on the same day. The blended RM0.19 is the number the business felt, and it is an average hiding a 2× spread I could act on. Open original image
Store visibility against every insurer app in Malaysia, tracked in AppTweak. iLyF is the dark red line starting near zero. The shape is the tell: incumbents hold a flat high line on brand, challengers spike and collapse when a burst campaign ends, and a steady eight-month slope is what listing and review work looks like when it compounds. Open original image
Estimated daily downloads over the same window. Early on, every peak of ours is a campaign we paid for and the floor between peaks is near zero. By the end the floor has risen underneath the peaks, so the same budget lands on an audience that now finds the app on its own, which is why the peaks got taller without the spend getting larger. Open original image
Scope: Growth · Data · Product
All benchmark sources and limitationsThe product behind the growth.
Acquisition was one part of the wider product, engineering, and delivery responsibility.