Skip to content
Faidhi Fahmi.
#productleader#problemsolver

I build scalable products
that solve real problems.

I turn ambitious technical blueprints into products people actually pay for — insurance platforms, acquisition engines, AI workflows, and the teams that ship them. Founders bring me in to own the path from concept to a market-ready platform.

app installs driven in 30 months
200K+app installs driven in 30 months
growth in monthly gross written premium
~8×growth in monthly gross written premium
LTV to CAC, against a 3:1 healthy benchmark
4.9LTV to CAC, against a 3:1 healthy benchmark
to recover customer acquisition cost
0.6 moto recover customer acquisition cost
Product LeadershipGrowth EngineeringProduct Design & UXDeep Analytics & InsightsAI Workflows & Internal ToolsGrowth Marketing

Services

Where I'm most useful.

Most of my work falls into a few patterns. Each one starts from a situation you'll recognise, and ends in something you can point at.

01

Product Strategy & Leadership

Technical execution has drifted from the business goal.

I step in to realign the path. I help teams define their core focus, pinpoint the exact workflows ripe for AI automation, and orchestrate the leap from an initial concept to a massive, market-ready platform.

  • A written product thesis the whole team can argue against
  • A roadmap sequenced by unit economics, not by loudest voice
  • An operating rhythm — one priority per cycle, specs with acceptance criteria, a QA gate allowed to send work back
Evidence: Building an insurance platform, and the team that shipped it

02

Product UX & Delivery

A great idea with no clear blueprint.

I define the mechanics. I translate abstract concepts into tangible states, flows, and architectures. Through rigorous prototyping and validation, I ensure the first version we ship is clear, intuitive, and built for engagement.

  • User flows, state machines and interface designs at the right fidelity to decide from
  • Working prototypes you can put in front of real users this week
  • A first release scoped so it can actually ship
Evidence: Five insurers behind one checkout

03

Product Growth

Early traction that has not turned into economics.

I dissect and optimise the entire user journey — from the first ad click to the final install — engineering a sustainable acquisition engine that maximises lifetime value while keeping acquisition costs aggressively low.

  • A channel structure where every campaign is accountable to cost per install
  • The retention loop found and closed before more money goes into the funnel
  • Store listing and organic surface treated as a compounding asset
Evidence: Engineering a high-efficiency acquisition engine

04

Data & Insights

Mountains of data creating more confusion than clarity.

I design the tracking and reporting ecosystems that answer the most critical question: what is actually happening? I turn overwhelming numbers into highly visible, actionable growth frameworks.

  • Instrumentation that measures the decision, not the vanity metric
  • Executive dashboards putting GWP, conversion, CAC and ROAS in one place
  • A weekly read the leadership team trusts enough to cut spend from
Evidence: A quarter-million contacts, made searchable

05

Workflows & Internal Tools

Scaling has broken your internal systems.

I design and implement the hidden infrastructure that lets a company run effortlessly. By automating operations and building bespoke internal tools, I remove the manual friction that slows great teams down.

  • The manual steps between a customer action and a fulfilled outcome, automated
  • Internal tooling your own team is willing to live inside
  • AI applied where it deflects real work, with an explicit escalation boundary
Evidence: Answering support before it becomes a ticket

Selected Works

Problems I was actually handed.

Ten systems I shipped for other people, written up as what the situation was, what I did about it, and what changed. Commercial figures are given as ranges — precise revenue belongs in a conversation.

Building an insurance platform, and the team that shipped it
ProductTechnicalTeam leadershipGrowth

iLyF — Easy, Instant Insurances

Building an insurance platform, and the team that shipped it

I came in to help build a personalised motor insurance app and ended up owning the whole delivery surface: the architecture, the insurer integrations, the growth engine, the analytics everyone argued from, and a distributed team across three countries.

app installations in 30 months
200K–250Kapp installations in 30 months
registered vehicles
150K–200Kregistered vehicles
Read the case study
Engineering a High-Efficiency Acquisition Engine
GrowthDataProduct

iLyF — Easy, Instant Insurances

Engineering a High-Efficiency Acquisition Engine

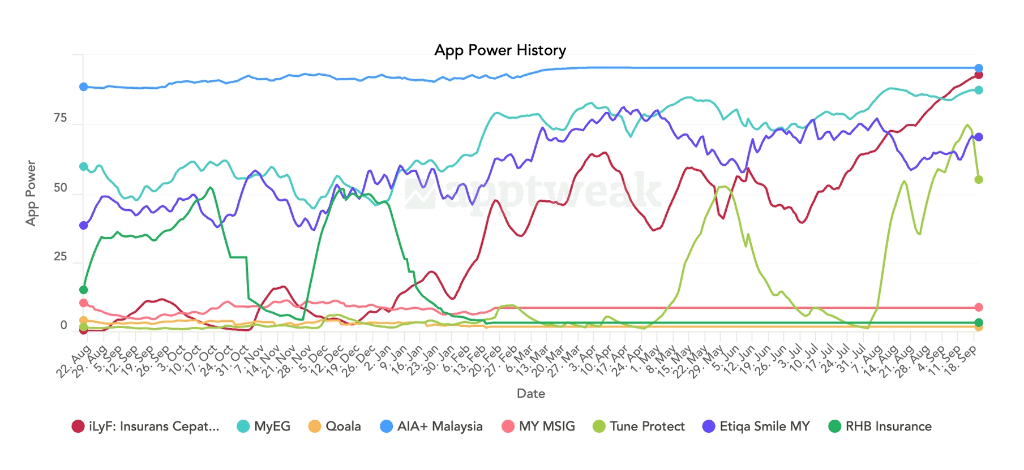
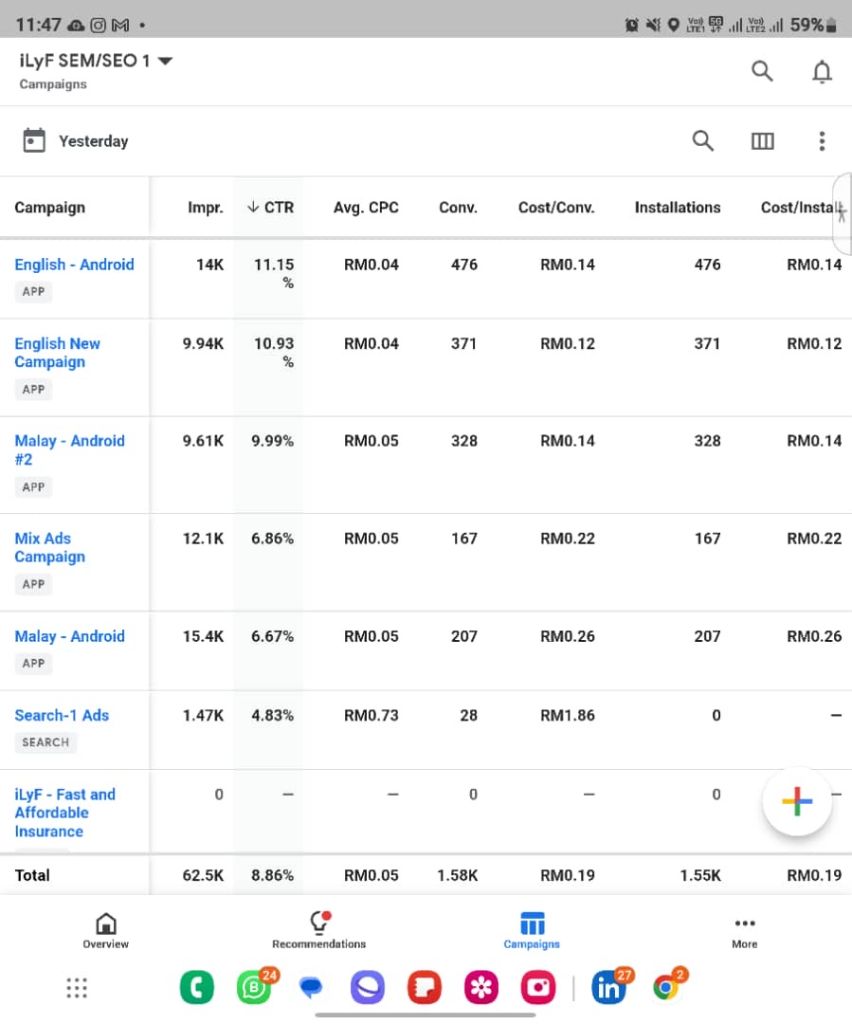
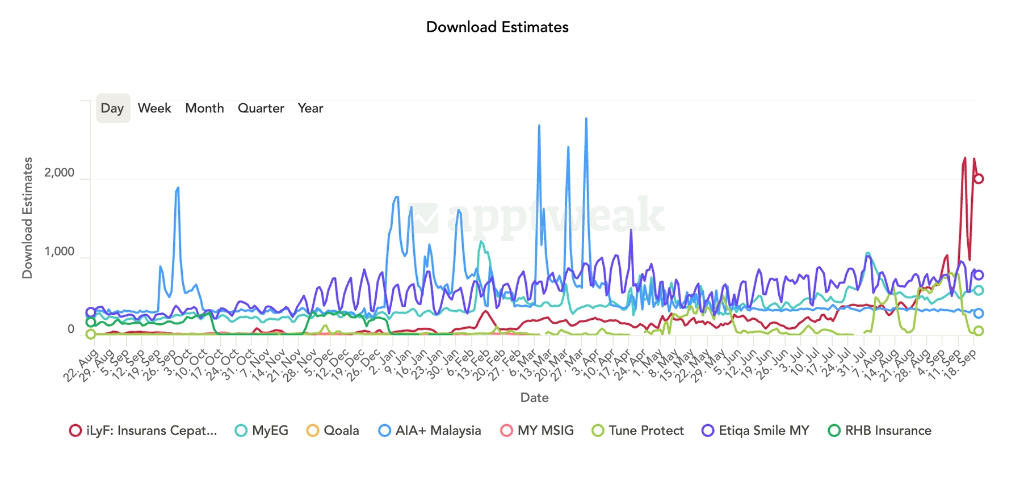
Installs between twenty sen and two ringgit depending on the month, a store listing that climbed from invisible to the top of the Malaysian insurance category, and acquisition cost recovered in about three weeks. The figures below are the working dashboards, read the way I read them at the time — including the single best day, which is labelled as such rather than passed off as the average.

cost per install, monthly actuals across the measured period
RM0.20–1.92cost per install, monthly actuals across the measured period
blended cost per install on the single day the dashboard below shows
RM0.19blended cost per install on the single day the dashboard below shows
Read the case study

Measured against the market

The same numbers, next to the published benchmarks.

A figure only means something against the market it was won in. Malaysia and the wider region are shown separately, every benchmark is published by a named third party and linked, and where no Malaysia-specific figure exists the row says so instead of borrowing the regional one.

Cost per install

My result

RM0.20 – RM1.92

Monthly actuals, Apr 2023 – May 2024 (~US$0.04 – US$0.41)

Malaysia

Up to US$16.13Finance apps, Ramadan bidding peakAppsFlyer, Ramadan SEA & Pakistan report, 2025

Regional / global

US$1.20 Android · US$0.93 APACAndroid average globally; APAC average across all categoriesMapendo, Cost per Install by Country, 2025

Finance is consistently the most expensive app category to acquire in. Every month measured came in under both the Android and APAC averages, and the good months came in an order of magnitude under them. The range is the honest version — the cheapest month was not the typical month.

Cost of a completed sign-up

My result

RM2.18

Q4 2024 average, down 28% from RM3.04 in Q3

Malaysia

RM2 – RM25+ per clickGoogle Ads CPC by vertical, ecommerce through legalOpenMinds Resources, Digital Ads Cost in Malaysia, 2026

Regional / global

No published figure at a comparable scope.

Read the units carefully, because they are the point: the Malaysian market rate for a single ad click starts around RM2, and this engine was landing a completed registration for RM2.18 — a whole customer for roughly what one click costs at the cheapest end of the market. It fell 28% quarter on quarter while sign-ups grew 36%.

Ad click-through rate

My result

3.9% – 9.8%

Monthly actuals, Feb – May 2024

Malaysia

No published figure at a comparable scope.

Regional / global

6.66%Google Ads cross-industry average, all industriesWordStream, Google Ads Benchmarks, 2025

The second row that does not flatter. Against a 6.66% cross-industry average the measured range straddles it — the good months ran about half again above, the weak ones below. The channels also differ: this was Google Ads app campaigns, which serve across Search, Display, YouTube and Play, while the benchmark is weighted to search. Treat it as directional, not a like-for-like win.

Click-to-install conversion

My result

15.7% – 21.3%

Monthly actuals, Feb – May 2024

Malaysia

No published figure at a comparable scope.

Regional / global

16.15%Google Play average, page views to installs, USAppTweak, average app conversion rate per category, 2025

Straight, because it does not flatter: the measured range straddles the Play Store average rather than clearing it. The best month ran about a third above it, the weakest month sat slightly below. The two figures also count different things — ad-click-to-install against store-page-view-to-install — and the benchmark is a US average, so treat this as adjacent, not identical.

Return on ad spend

My result

1.21 → 1.65 gross · 0.61 → 1.01 net

Q3 2024 to Q4 2024

Malaysia

No published figure at a comparable scope.

Regional / global

0.7 – 1.1 at D90Target payback band, subscription & fintech apps, globalSegwise, ROAS benchmarks by industry, 2026

Compared against the band fintech and subscription apps actually plan to, not the ecommerce blended average of roughly 2.9 — an annual insurance premium is not an ecommerce basket. The number that matters is net crossing 1.0 in Q4: the quarter the acquisition engine started paying for itself rather than being funded.

LTV to CAC ratio

My result

4.4 – 4.9

Q4 2024, up from 2.6 – 3.3 in Q3

Malaysia

No published figure at a comparable scope.

Regional / global

3:1 healthy · 3.2:1 median · 5:1+ strong939 B2B SaaS companies, Q2 2025 – Q1 2026Optifai, B2B SaaS LTV benchmarks, 2026

The single ratio that decides whether an acquisition engine is a business or a subsidy. It moved from roughly at the 3:1 rule to comfortably above it inside two quarters — driven by cost per acquisition falling, not by assuming a longer customer life.

CAC payback period

My result

0.6 months

Q4 2024 (0.58 – 0.65 across the quarter)

Malaysia

No published figure at a comparable scope.

Regional / global

Under 12 months healthySaaS payback benchmarks, globalDrivetrain, CAC payback period benchmarks, 2026

Acquisition cost recovered in under three weeks. This comparison flatters and it is worth saying why: an insurance transaction books its revenue immediately, while a SaaS subscription recovers the same cost a month at a time. The right read is not that this beats SaaS — it is that the model throws off cash fast enough to fund its own growth.

The market being sold into

My result

Renewal automated at 60/30/7/1 days before expiry

Renewal treated as a product surface, not a campaign

Malaysia

102.2% combined ratio · motor = 42.8% of premiumsMalaysian motor insurance, H1 2025Mordor Intelligence, Malaysia Motor Insurance Market, 2025

Regional / global

No published figure at a comparable scope.

A combined ratio above 100% means the Malaysian motor market was paying out more than it took in, on the line that is the largest in general insurance at 42.8% of premiums. In a market underwriting at a loss, acquisition efficiency and renewal are the only levers left — which is why renewal was built as a product surface rather than handed to marketing.

Benchmarks are third-party published averages, quoted at the scope their publisher actually measured, and each was re-checked against that publisher's own reported figure. Four were corrected in that pass and every correction made the comparison less flattering, not more — the click-through row went from a clear win to a straddle. One benchmark was removed outright because it could not be substantiated against the publisher it was credited to, which is why the retention column is empty rather than filled.

Note that Bank Negara's motor “retention ratio” measures risk retained domestically rather than reinsured — it is not customer retention, so it is not used as one above.

Recommendations

What the people I shipped with actually said.

Unedited LinkedIn recommendations from founders, engineers, designers and directors I've worked alongside.

Junxian Lee
If there was ever a person that was the epitome of a self-sharpening swiss-army knife, Faidhi would certainly be it. I've known Faidhi for years and it's astounding how far he is able to pick up a wide array skills... Essentially a one-man-army.
Junxian LeeGoodWhale | AI | Technology
01 / 13

Working Together

How I usually plug in.

Every team and product is different, but most projects follow a simple approach.

  1. Start where it hurts

    It starts with what hurts and what you are trying to achieve. You walk me through the product, site, or tool, and I talk with a few users or people close to the work so I can map the current flows, content, and constraints and we agree on what problem we are really solving.

  2. Shape and prototype

    Next, I turn that understanding into clear structures and directions. That might look like user flows, interface designs, system diagrams, or vibe-coded prototypes, always at the right level of fidelity so we can react to something concrete and make decisions together.

  3. Build, instrument, refine

    Once we like a direction, I stay involved through the first versions. I work with your team to get it built, add enough measurement and feedback to learn from it, and then refine based on how real people actually use it, going beyond just the day it goes live.

The principles behind the calls I make

Simplicity First

Users shouldn't need a manual. I believe in designing interfaces that intuitively guide the user, quietly doing the heavy lifting in the background.

Fluid over Rigid

I care about shipping great products, not worshiping a process. Whether it's Kanban, Scrum, or a mix of both, we use whatever accelerates our momentum.

Objective Truth

We track everything that matters. From the first click to the final transaction, we rely on concrete metrics to validate our hypotheses and drive continuous optimization.

Automation with Empathy

We aggressively automate the mundane, but we never remove the human touch where it matters. Our systems empower the team to make better, faster decisions.

Team as the Engine

A burned-out team ships broken products. I focus on removing operational friction, preventing burnout, and ensuring the team has the tools and trust they need to maintain momentum without sacrificing their well-being.

Benevolent Dictatorship

I listen to everyone, but I don't wait for consensus. Design by committee kills innovation. I take the input, make the hard calls, and own the results so the team can stop debating and start building.

Let's Connect 👋

If this sounds right, let's talk.

A short conversation is usually enough to see if there's a fit.

Fastest route: put a time on the calendar.

Book an advisory call

Otherwise, choose your own adventure…

I read every message myself and will reply when I see a possible fit.

Let's start simple…

FAQs

A few questions people usually ask.